| Version 16 (modified by , 10 years ago) ( diff ) |
|---|
PathFinder
PathFinder is a lightweight back-in-time debugger for navigating through specific test case behavior and state. It assists developers in localizing root causes by accessing entire execution histories, highlighting infection chains, and answering questions about object states.
Description
A test case executes one specific path through the system which can be recorded with all its behavior and state to understand the complete execution history. However, traditional approaches for analyzing a program’s run-time are time-consuming and expensive. They capture comprehensive information about the entire execution up-front, which is in large parts not required at all. We solve this problem with the reproducible and deterministic properties of test cases. We assume that a test case always takes the same path through the system so that each execution comprises the same behavior and state information. With this insight, we are able to split the expensive analysis of a program’s run-time over multiple test runs. Based on developers’ decisions, we divide the analysis into multiple steps: A high-level analysis followed by on-demand refinements. Thus, we incrementally collect only the data developers are interested in and so reduce the analysis overhead to a minimum while preserving instantaneous access to detailed execution histories.
Based on this analysis technique, PathFinder implements a lightweight back-in-time debugger for introspecting specific test case executions that supports the characteristics of immediacy. Moreover, this tool reuses PathMap's anomalies in order to classify traces with suspicious behavior and state. So, developers can follow infection chains back to their root causes without much effort.
See also the following tutorials: Test-driven Fault Navigation and Back-in-time Debugging.
Screenshot

How to Use
- First, you need a proper Path project that is selected as current. For more information see PathProject.
- To start PathFinder choose the tool either in the world docking bar at the top (Apps -> PathFinder) or in the world menu (open... -> PathFinder).
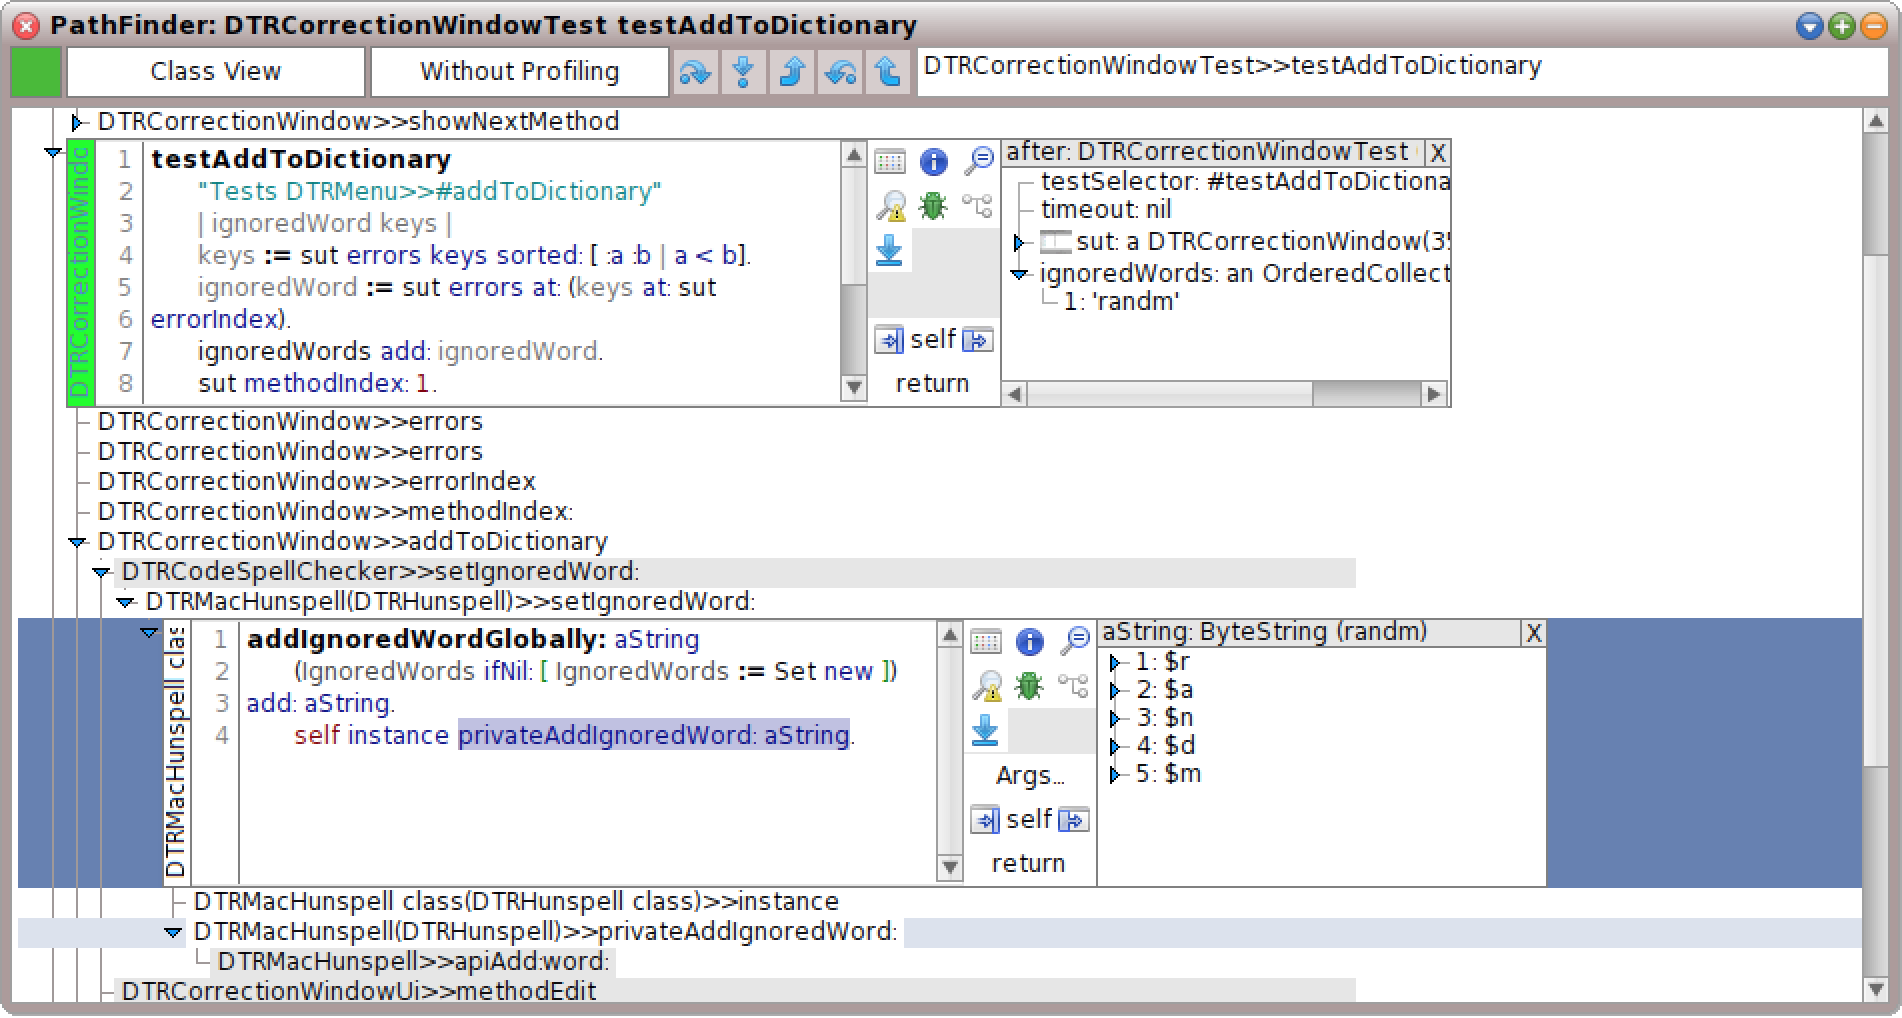
- After that, you will see a tool as in the screenshot above with a large white space in the middle.
- In order to get the execution history of a specific test case, please click on the rectangle in the upper left corner and choose the corresponding test case from the list.
- Afterwards, the executed call tree is presented in the former white area below and developers can start exploring its execution history.
Note: Developers can start exploration either directly at a test case or out of covered methods as provided by PathMap. Subsequently, PathFinder opens at the chosen method instead of the test case's beginning.
User Interface
PathFinder's main components are a control panel on the top and the test case call tree representing its execution history at the bottom.
Control Panel
The control panel offers from left to right the following buttons and input fields:

- Colored rectangle (left, Green)
- Controls the specific test case for PathFinder's analysis. Developers can choose a new test case for back-in-time debugging or rerun the currently selected one. The color represents the test case result (green = pass, yellow = failure, red = error).
- Drop down list button (Class View)
- Choose between three options and enhance the recorded information of called methods:
- Class View: Standard (fastest option), method calls are recorded and shown only with their receiving and implementing class.
- Object View: Shows the #printString of receiving objects instead of their class. This allows developers to present more specific information for each object by implementing their own #printString method.
- Identity View: Adds a number behind each method's class in order to identify same objects in the call tree more easily. This view relies on the identity hash.
- Drop down list button (Without Profiling)
- Choose between four options and enhance the call tree analysis with profiling information:
- Without Profiling: Standard, no profiling information is recorded (fastest option).
- Relative % Profiling: Presents the percentage value of the entire computation time for a specific method call.
- Absolute ms Profiling: Presents the milliseconds of the entire computation time for a specific method call. This also includes the overhead by our analysis.
- Call Counts: Counts the number of calls to the same method. For example, helps to distinguish similar method calls in a large loop construct.
- Five icon buttons (from left to right)
- Allows to step the execution in the call tree and its methods in all direction (forward and backward). Requires to activate the stepping within a method (see below).
- step over: Steps over the currently emphasized statement.
- step into: Steps into the currently emphasized statement and its corresponding method call.
- step return: Steps to the method return and continues after the statement that called the chosen method.
- step back: Steps back to the previous statement.
- step to sender: Steps back to the method that called this method and continues before the statement that called the chosen method.
- Text box (right, DTRCorrectionWindowTest>>testAddToDictionary)
- Represents a simple search field that tries to match the string with labels in the call tree. Results will be highlighted in the call tree.
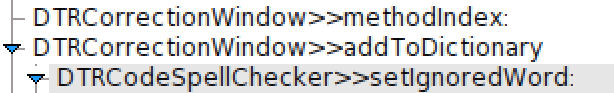
Call tree
The method call tree represents the order of all called methods (as part of the system under observation) and so forms the execution history that can be explored by developers. Our call tree consists of two views for called methods.

In the beginning, the call tree is just a simple tree where methods call other methods within their sub trees. Each label consists of an optional icon and a method name depending on the chosen view options from the control panel (see above). The icon represents the corresponding color from our PathMap analysis and also shows the maximum colored value of its subtrees (called methods). This gives developers an overview of the entire execution history and also allows them to follow specific highlights (for example, failure cause probabilities). If they need more details, they can click on a specific method call and come to the second view.

Second, with a click on a specific method call, we extend
Attachments (5)
- pathFinderLarge.png (183.0 KB ) - added by 10 years ago.
- pathFinderLargeControl.png (11.3 KB ) - added by 10 years ago.
- pathFinderLargeMethodCallTree.png (12.6 KB ) - added by 10 years ago.
- pathFinderLargeMethodLarge.png (34.4 KB ) - added by 10 years ago.
- pathFinderLarge.2.png (183.0 KB ) - added by 10 years ago.
Download all attachments as: .zip