| Version 29 (modified by , 10 years ago) ( diff ) |
|---|
PathMap
PathMap is an extended unit test runner that provides valuable feedback for software maintenance tasks such as debugging, testing, and program comprehension. This tool that does not only verify test cases but also analyze them in order to provide feedback about test quality, identify failure causes, derive likely invariants, and trace requirements.
Description
Test cases possess a valuable source of information as they implicitly define expected and unexpected behavior all over the system. During the execution of their exemplary assertions, they do not merely cover directly-tested methods but rather large call sequences with corresponding states through internal parts of the system. Based on this idea, we can inductively derive from the specific run-time values of executed test cases more generalized and helpful program properties. For example, our type harvesting exploits test cases to obtain type information for a code base automatically. We derive type data from the concrete objects used during test case executions and provide developers this hidden information to assist in navigating source code and using application programming interfaces (APIs) correctly. By making this hidden test knowledge available, developers have additional information for debugging, testing, and understanding their programs.
PathMap is our extended test runner that reveals the hidden knowledge of test cases and presents it to developers. It provides a low overhead analysis framework that computes coverage data, likely invariants, and static metrics and displays the results in form of a scalable tree map visualization representing the system under observation.
For more specific use cases, see also the following tutorials: Test-driven Fault Navigation (Debugging), Test Quality Feedback (Testing), Type Harvesting (Program comprehension), and Requirements Traceability (Program comprehension).
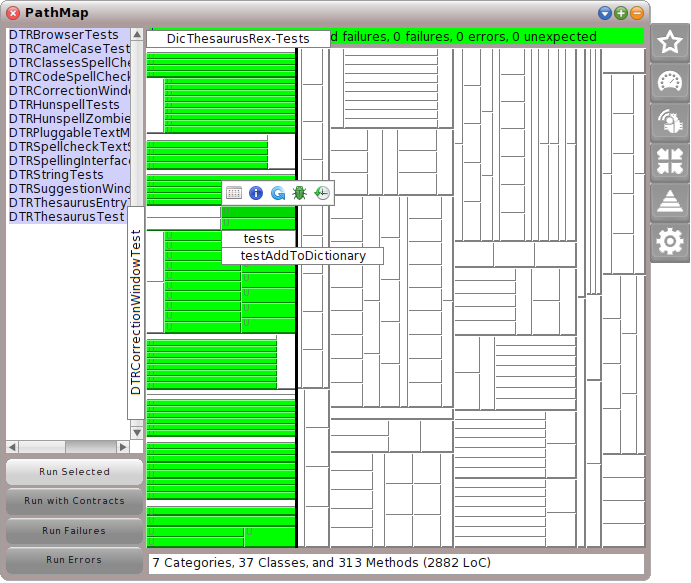
Screenshot

How to Use
- First, you need a proper Path project that is selected as current. For more information see PathProject.
- To start PathMap choose the tool either in the world docking bar at the top (Apps -> PathMap) or in the world menu (open... -> PathMap).
- Depending on the project size, it can take some seconds for computing the static analysis in background.
- After that, you will see a test runner that looks in parts similar to the original one.
- You can select tests from the list on the left and run them with the buttons below.
- Test results are then presented in the middle. At the top, you will see the summarized test results as usual, in the middle a large tree map represents the system under observation (green, yellow, and red rectangles represent the test results and can interactively be explored), at the bottom you will find some static project metrics.
- On the right side, you will find some flaps that allow PathMap to reveal hidden test knowledge within the next run (for more information see below).
User Interface
PathMap supports several analysis modes that can be activated by selecting and extending the corresponding flap on the right side. After that, running test cases will automatically include the chosen analysis.
Test Runner
With no extended flap, PathMap acts like an ordinary test runner (no analysis in background without any performance slow down). Its main components are the test control panel (left), the tree map in the middle, and its specific flaps on the right.
- Left pane (list)
- Displays all test cases (suites) within the current Path project. Developers can select, which of them should be executed by clicking on the Run Selected button.
- Left pane (buttons)
-
- Run Selected: Executes the selected tests with activated analysis if a flap is open. Otherwise, tests are executed without any analysis.
- Run with Contracts: If contracts are available, tests can be run and checked for contract violations (see Induction Flap below). Violations are shown in the tree map with small exclamation marks. The corresponding background analysis still depends on opened flaps.
- Run Failures: Executes only (yellow) tests that have failed before. Analysis depends on opened flaps.
- Run Errors: Executes only (red) tests that have an error before. Analysis depends on opened flaps.
- Text box (top)
- Summarizes test results (passed, failed, errors, and expectations) as usual.
- Tree map (middle)
- Represents a structural system overview and its relation to test execution. This visualization represents categories/packages as columns and their classes as rows. Each class represents each of its methods as a box. In addition to it, methods are optionally ordered in columns with respect to their method category. The allocated space is proportional to the number of methods per node. Packages, classes, and methods are sorted alphabetically and for a clear separation we distinguish between test classes on the left-hand side and application classes on the right-hand side. Developers can systematically explore the visualization and interactively obtain more details about specific method boxes such as its name and covering tests. Moreover, each method can be colored with a hue element for reflecting specific analysis metrics. In addition to that, the visualization colors a test method in green, yellow, or red if the test respectively succeeds or fails.
- Interactive elements on tree map (morphs)
- Each small rectangle morph represents a method of the system under observation. Methods with a u mark unit test methods. By interactively hovering over the visualization, labels present the current selected source code entity. With a click on a box the following buttons can appear on a method.
 The standard buttons that are mostly available. Browse opens a source code browser for this specific method (Note: If a coverage analysis has been chosen (test quality or fault localization flap), this will also refine the coverage results at the statement-level. The browser underlines the corresponding statements). Information opens a new dialog that shows additional data about the computed analysis metrics (color in the method). Rerun allows developers to rerun one specific test case. This button is only available for unit test methods (u mark). Debug sets a breakpoint in the chosen method and runs a specific test that covers this method. Thus, a symbolic debugger opens at the chosen method and allows developers to explore its run-time behavior. Pathfinder opens our lightweight back-in-time debugger at the chosen method. This allows developers to explore the entire execution history of a specific test case that the chosen method is involved.
 If contracts are available and a specific method includes violations, this button allows developers to further inspect the violated assertions. The same icon highlights methods in the tree map, if violations have been occurred.
 If the tree map has not enough space for displaying all methods, it automatically summarizes them into their classes. Only a large rectangle is available that can be further explored at the method level with this button.


- Text box (bottom)
- Summarizes some static project metrics such as number of classes and methods or lines of code (LoC).
In the following, we will present each flap on its own.
Test Quality Flap
The test quality flap analyzes the (method) coverage of test cases (effectivity) and relates it to different static metrics. This allows developers to answer questions such as which methods require more tests and which author is responsible for missing tests.
See also: Test Quality Feedback

No Static Metric drop down list (top)::
Sort Methods by Metric button::
Methods drop down list::
Color legend (bottom)::
Profiling Flap
The profiling flap measures the run-time characteristics of test cases (efficiency) and their relation to the methods of the system under observations. Performance bottlenecks, memory leaks, and massively called methods are revealed with this analysis.
See also: Test Quality Feedback

Method Calls drop down list (top)::
Profile Leafs button::
Color legend::
Highscore button::
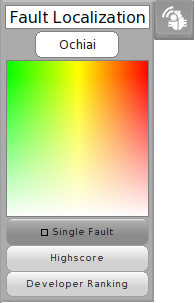
Fault Localization Flap
The fault localization flap reveals spectrum-based anomalies (methods) that have a high probability to include failure causes. By comparing the coverage of all failed and passed test cases, we offer several starting points for debugging failing test cases and creating initial failure cause hypotheses.
See also: Test-driven Fault Navigation

Ochiai drop down list (top)::
Color legend::
Single Fault button::
Highscore button::
Developer Ranking button::
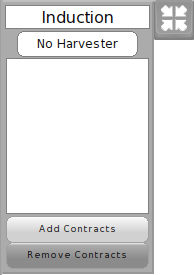
Induction Flap
The induction flap derives likely invariants from passing test cases. We expect that every state (parameter, receiver, return value) of a passing test is also a valid data point. Based on this assumption, we generalize concrete run-time values all over the system into assertions. Such likely invariants can help in program comprehension as well as debugging if they are compared to failing test cases.
See also: Test-driven Fault Navigation and Type Harvesting

No Harvester drop down list (top)::
Color legend::
Add Contracts button::
Remove Contracts button::
Traceability Flap
The traceability flap connects arbitrary concerns and software artifacts with test cases in order to analyze their relationship with the code base. For example, requirements can be related to their acceptance tests and we compute methods that overlap or are completely specific to requirements.
See also: Requirements Traceability

No Menu Entry drop down list (top)::
Selection list::
Concerns... button::
Color legend::
Specific Only button::
Multiple Colors button::
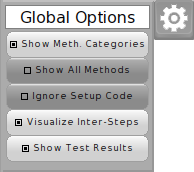
Global Options Flap
The global options flap allows developers to configure analysis and visualization properties.

Show Meth. Categories button::
Show All Methods button::
Ignore Setup Code button::
Visualize Inter-Steps button::
Show Test Results button::
Attachments (10)
- pathMap.png (62.1 KB ) - added by 10 years ago.
- testQualityFlap.png (11.4 KB ) - added by 10 years ago.
- profilingFlap.png (10.7 KB ) - added by 10 years ago.
- faultLocalizationFlap.png (20.0 KB ) - added by 10 years ago.
- inductionFlap.png (10.7 KB ) - added by 10 years ago.
- traceabilityFlap.png (12.5 KB ) - added by 10 years ago.
- optionsFlap.png (13.4 KB ) - added by 10 years ago.
- pathMapMorphButton1.png (5.7 KB ) - added by 10 years ago.
- pathMapMorphButton2.png (3.6 KB ) - added by 10 years ago.
- pathMapMorphButton3.png (3.7 KB ) - added by 10 years ago.
Download all attachments as: .zip