| Version 12 (modified by , 10 years ago) ( diff ) |
|---|
PathBrowser
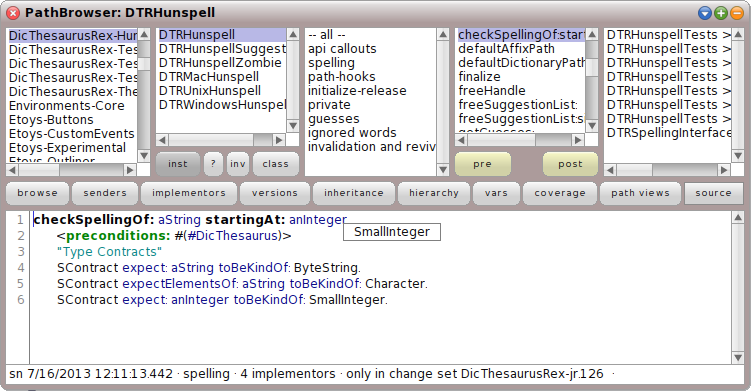
PathBrowser extends Squeak’s standard source code browser with additional user interface elements that provide access to Path's analyzed test information. So, developers can further improve their program comprehension with revealed coverage data, type information, and derived assertions about the system under observation.
Description
After analyzing the system with our PathMap, we offer developers access to the derived information with our extended source code browser called PathBrowser. We enhance the standard browser with mainly five new features:
- Test coverage: We reuse the already collected test coverage data from PathMap and present it in a new pane. With a click on a corresponding test case, developers can start a symbolic debugger or our PathFinder. Both tools stop their execution at the first call of the selected method and provide insights into its concrete run-time behavior.
- Statement coverage refinement: Based on the already collected test coverage, developers can also refine coverage data at statements on demand. For that, we re-execute all covering tests, analyze the currently selected method, and present the executed statements by underlining the corresponding source code.
- Type information: With the help of our type harvesting approach, we have already gathered type information for instance variables, arguments, and return values from test cases. To support program comprehension during implementation tasks, we present this data with overlays that appear when developers mark a related variable.
- Contracts: We extend the browser with dynamic contracts from our test-driven fault navigation. There are buttons for displaying the source code of invariants (inv), pre- and post-conditions (pre/post). Developers can also add manual assertions to this source code.
- PathView: We offer a button to open a model-based source code view directly from the selected class or method snippet.
Screenshot

How to Use
- First, you need a proper Path project that is selected as current. For more information see PathProject.
- To start PathBrowser choose the tool either in the world docking bar at the top (Apps -> PathBrowser) or in the world menu (open... -> PathBrowser).
- Since our new features require access to information from the current project, all functionality is only available if developers browse classes that are part of the project's selected categories and the required information has already been analyzed with our PathMap. If this is not the case, the related features are disabled.
- Optionally, we also recommend to make PathBrowser your new default browser. Start a standard browser, click on the blue button (top-right corner), select choose new default browser, and select SBrowser.
User Interface Extensions
- Fifth pane (on the right side)
- This pane displays all test cases that cover the selected method in the fourth pane (left side). With a click on a test case, developers can open a new browser with the corresponding test, a symbolic debugger, or our lightweight back-in-time debugger PathFinder. While the symbolic debugger sets a breakpoint in the corresponding method, run the chosen test case, and starts the debugger at the covered point in time. Our PathFinder analyzes the entire test case execution and highlights all occurrences of the chosen method within this behavior.
- Buttons (inv, pre, post) below class pane respectively method pane
- XXX inv/pre/post -- contracts & anzeige im browser fenster
- Coverage button
- XXX new buttons coverage (underlined statements),
- Path views button
- XXX path views (ref)
- Overlay at variable identifiers
- XXX overlay for type information (ref to type harvesting)
Attachments (1)
- pathBrowser.png (66.0 KB ) - added by 10 years ago.
Download all attachments as: .zip
Note:
See TracWiki
for help on using the wiki.